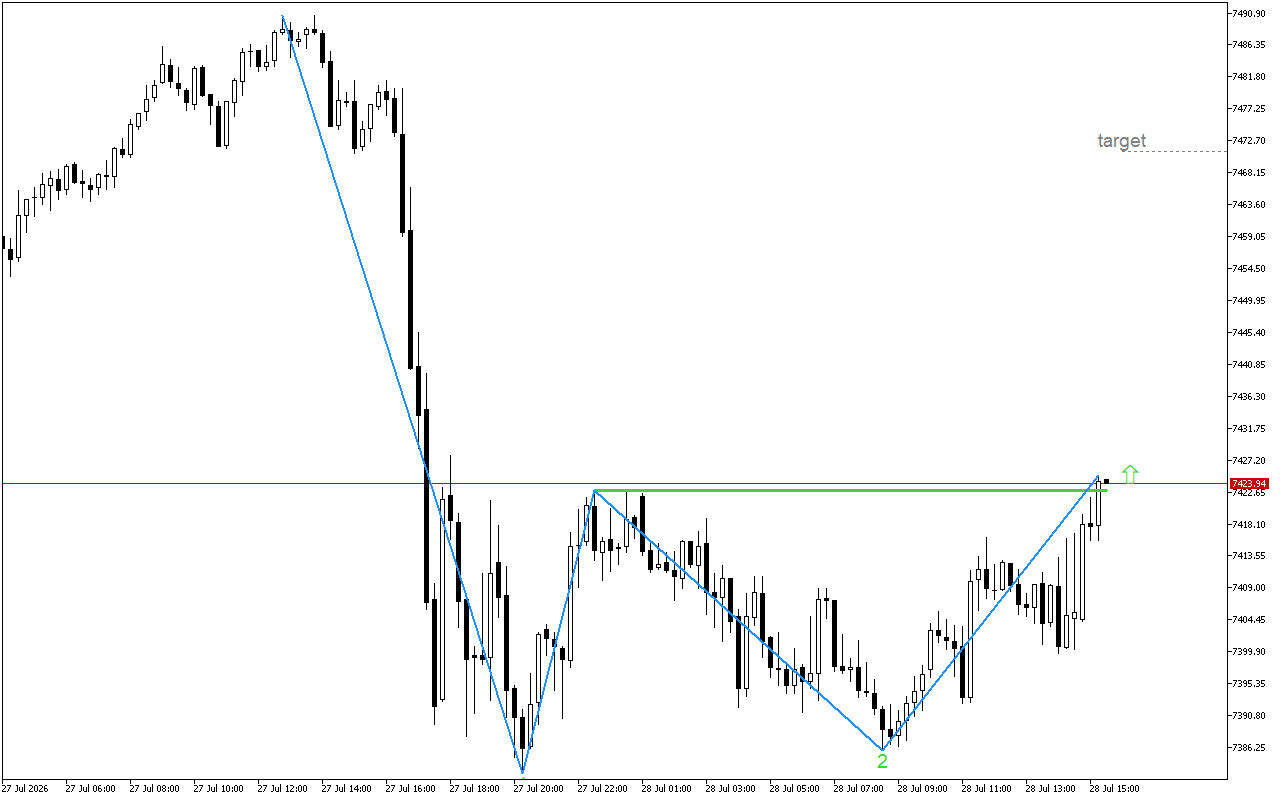
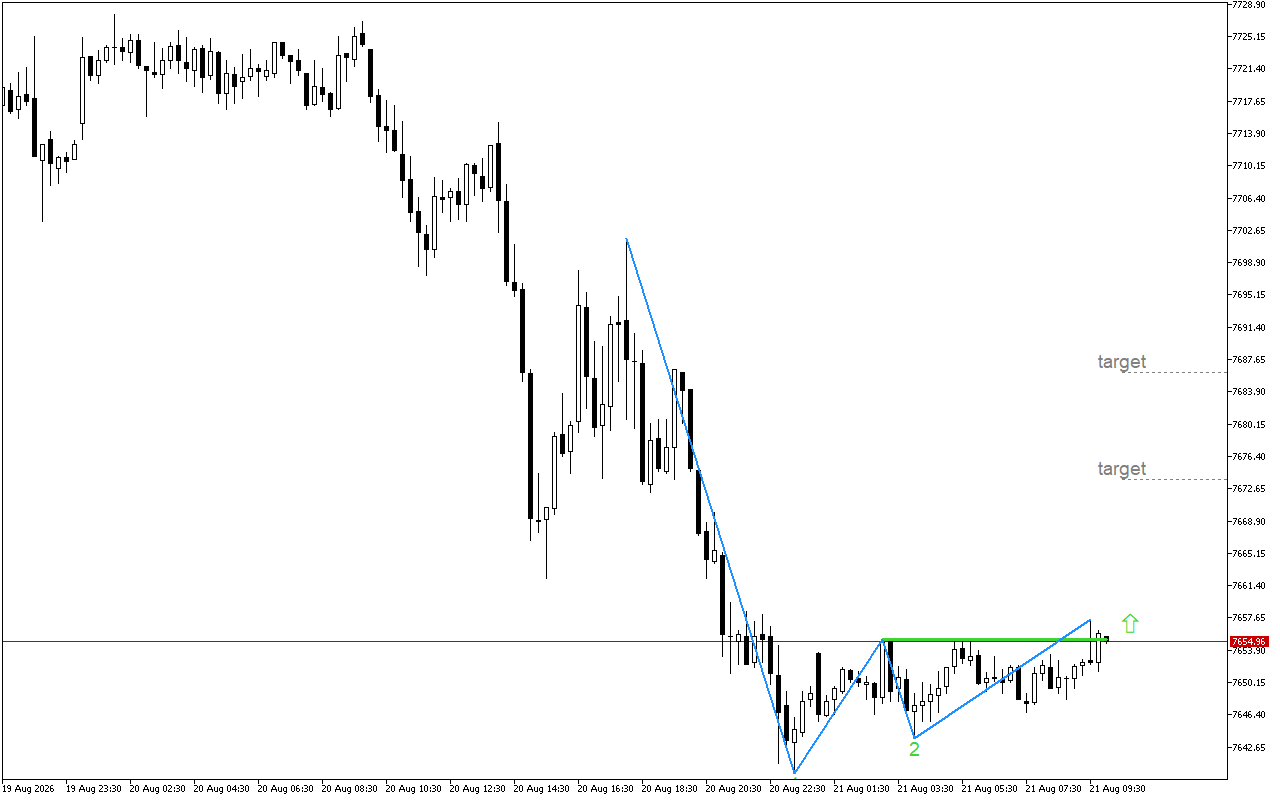
S&P 500 M15: The Double Bottom pattern indicates a possible change in the direction of price movement
In the current timeframe, there is a decrease in the selling interest. This may lead to the reversal of S&P…
In the current timeframe, there is a decrease in the selling interest. This may lead to the reversal of S&P…
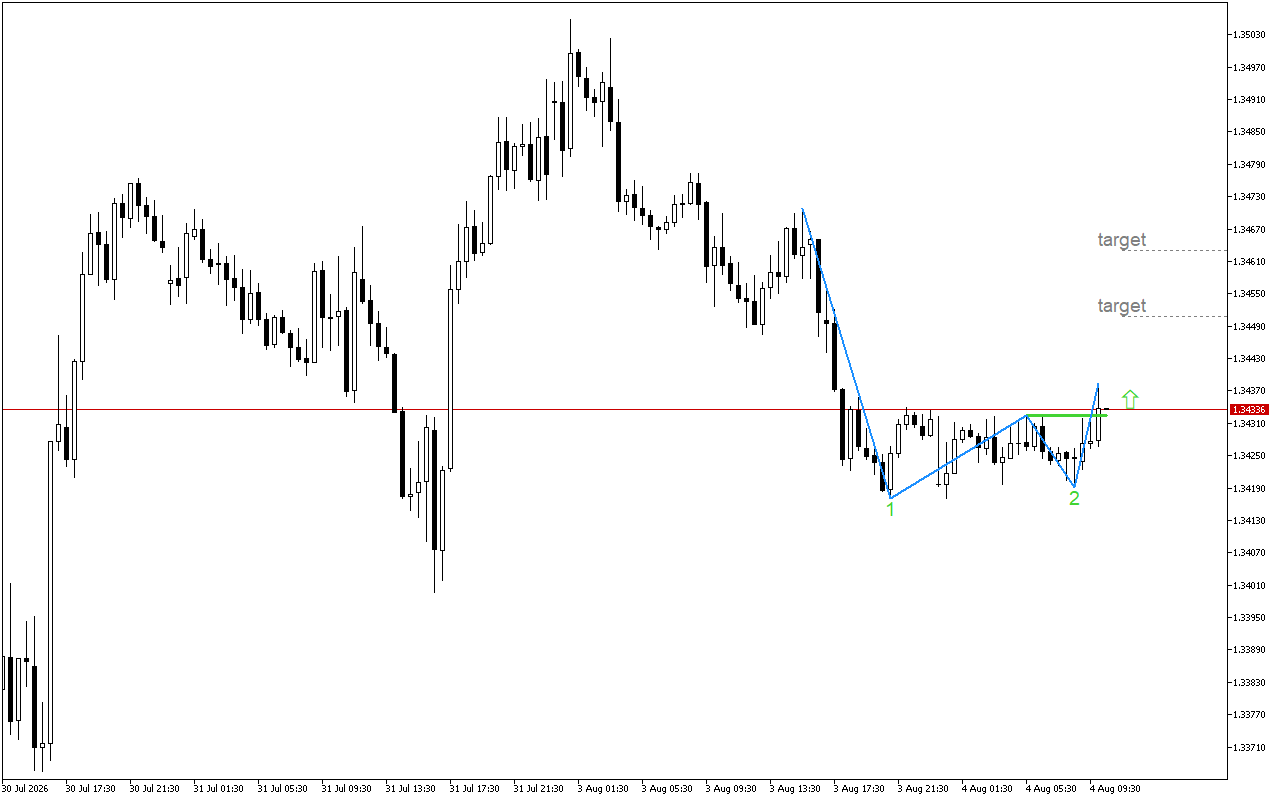
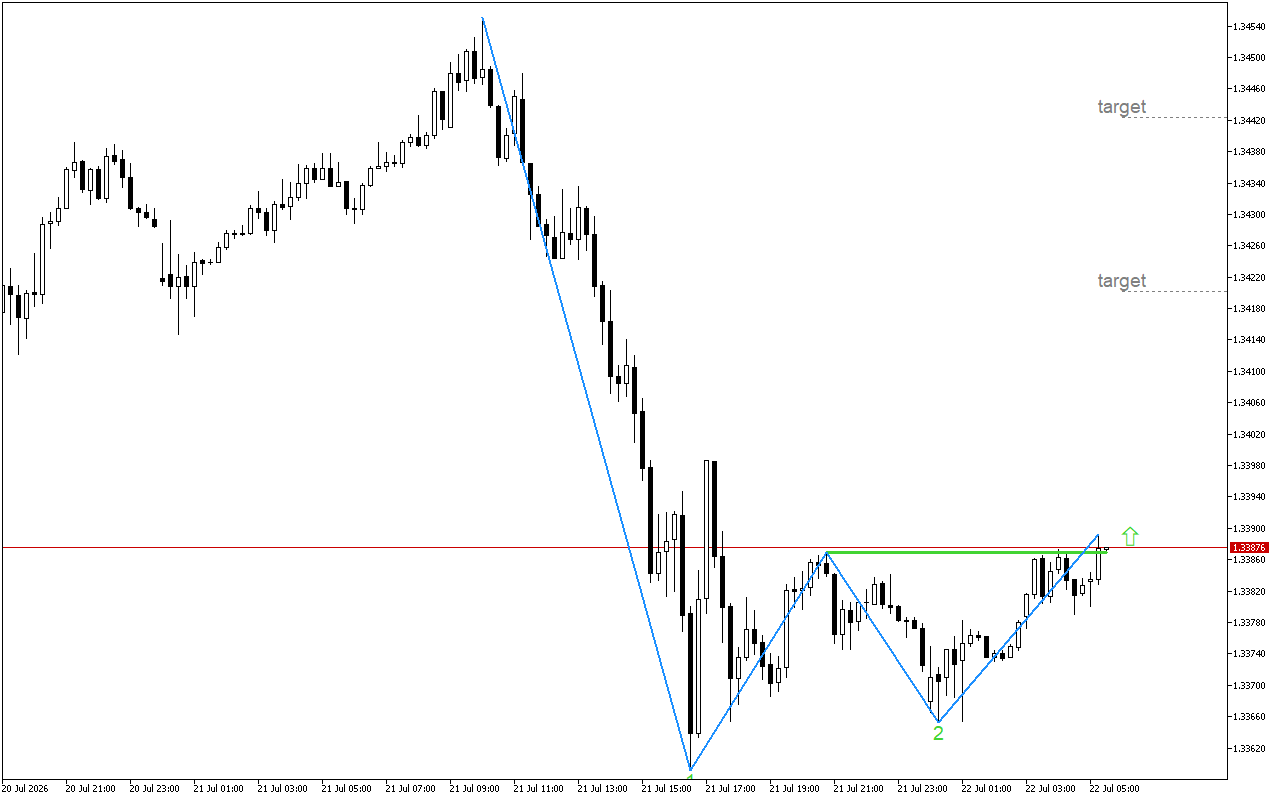
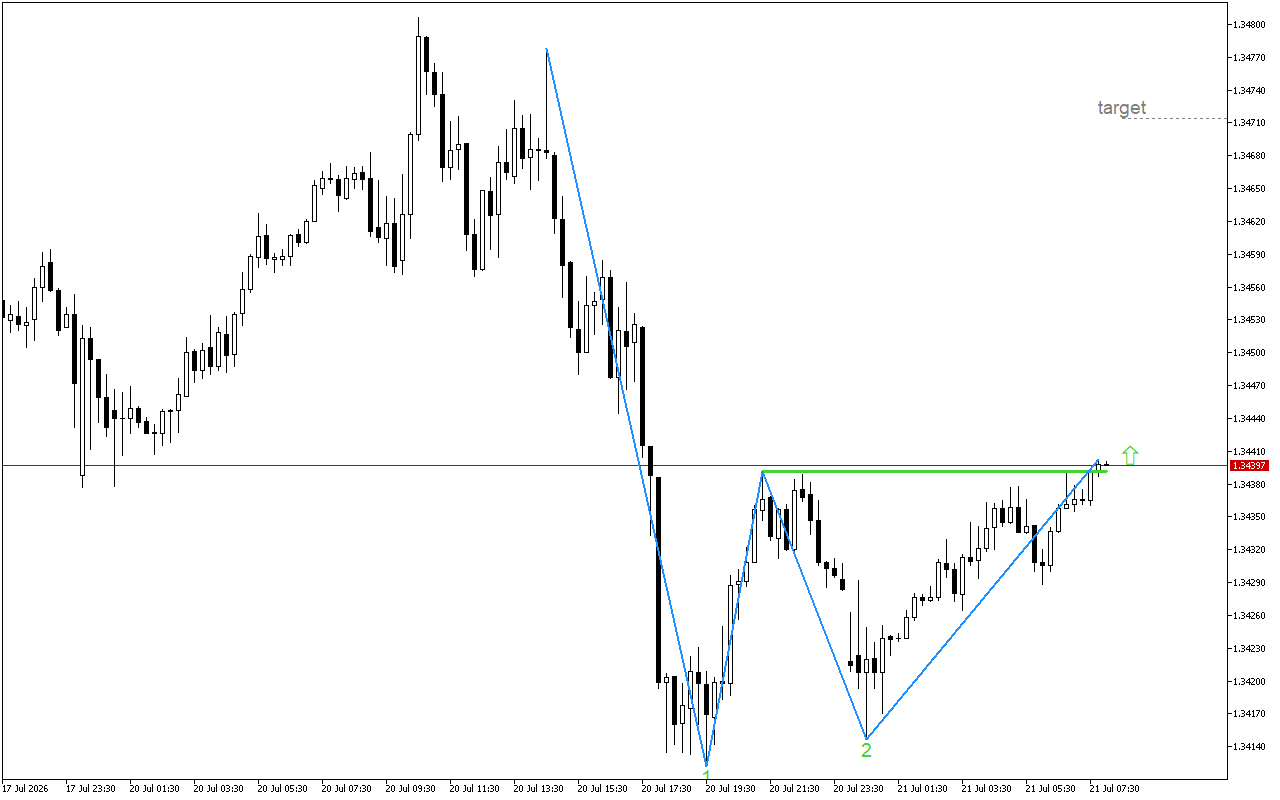
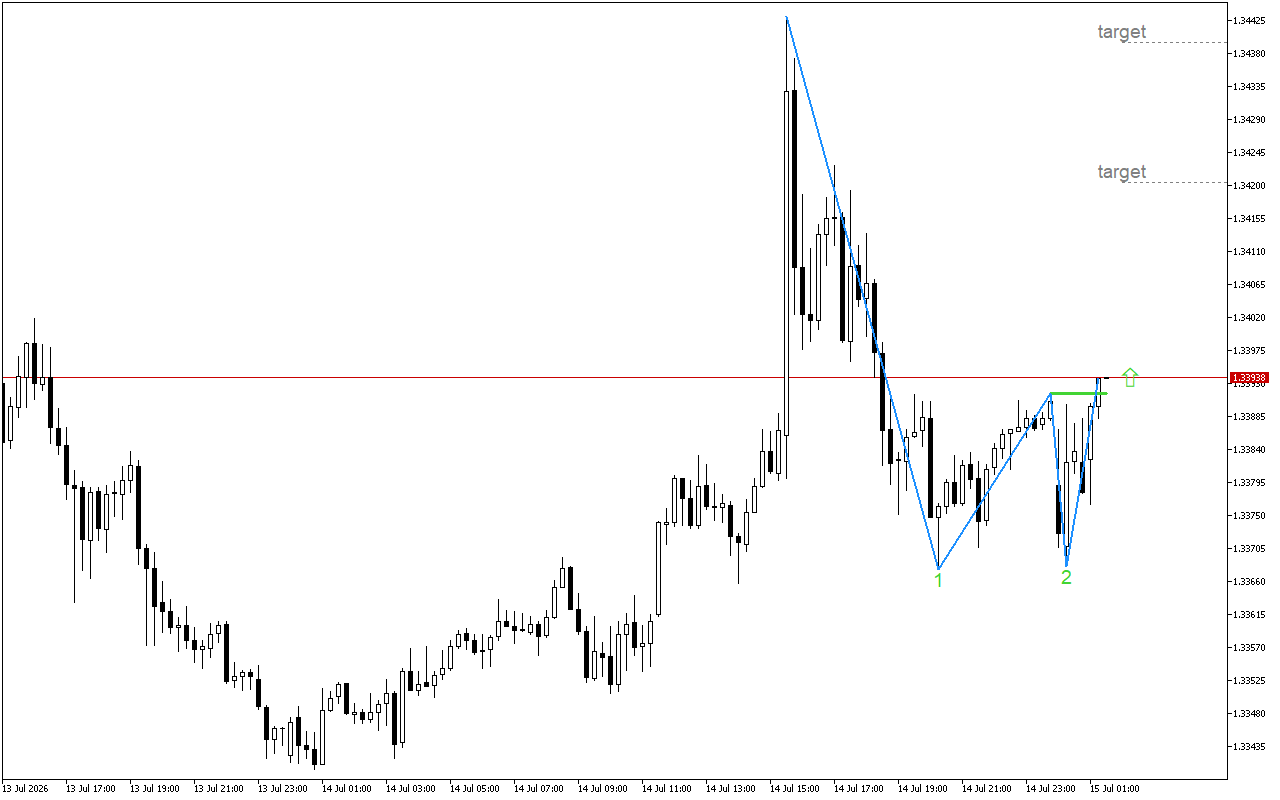
In the current timeframe, there is a decrease in the selling interest. This may lead to the reversal of GBPUSD.A…
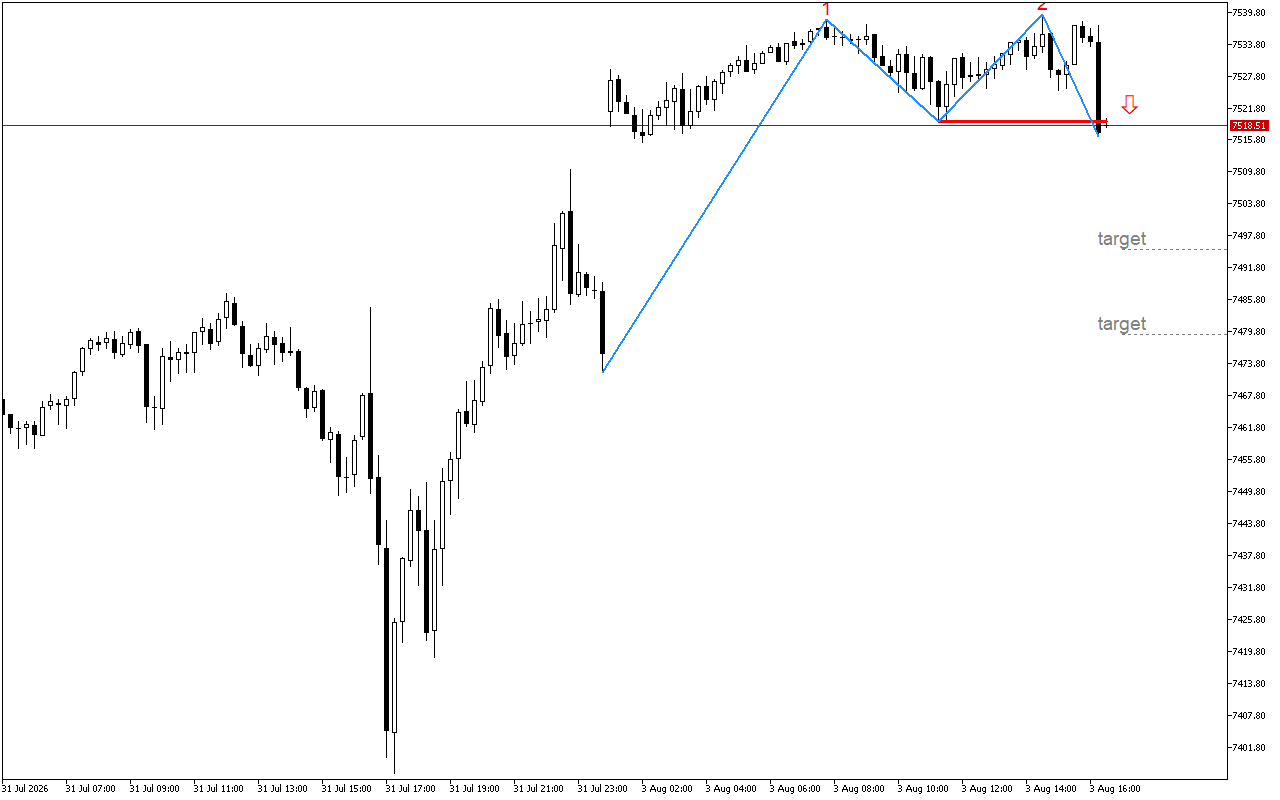
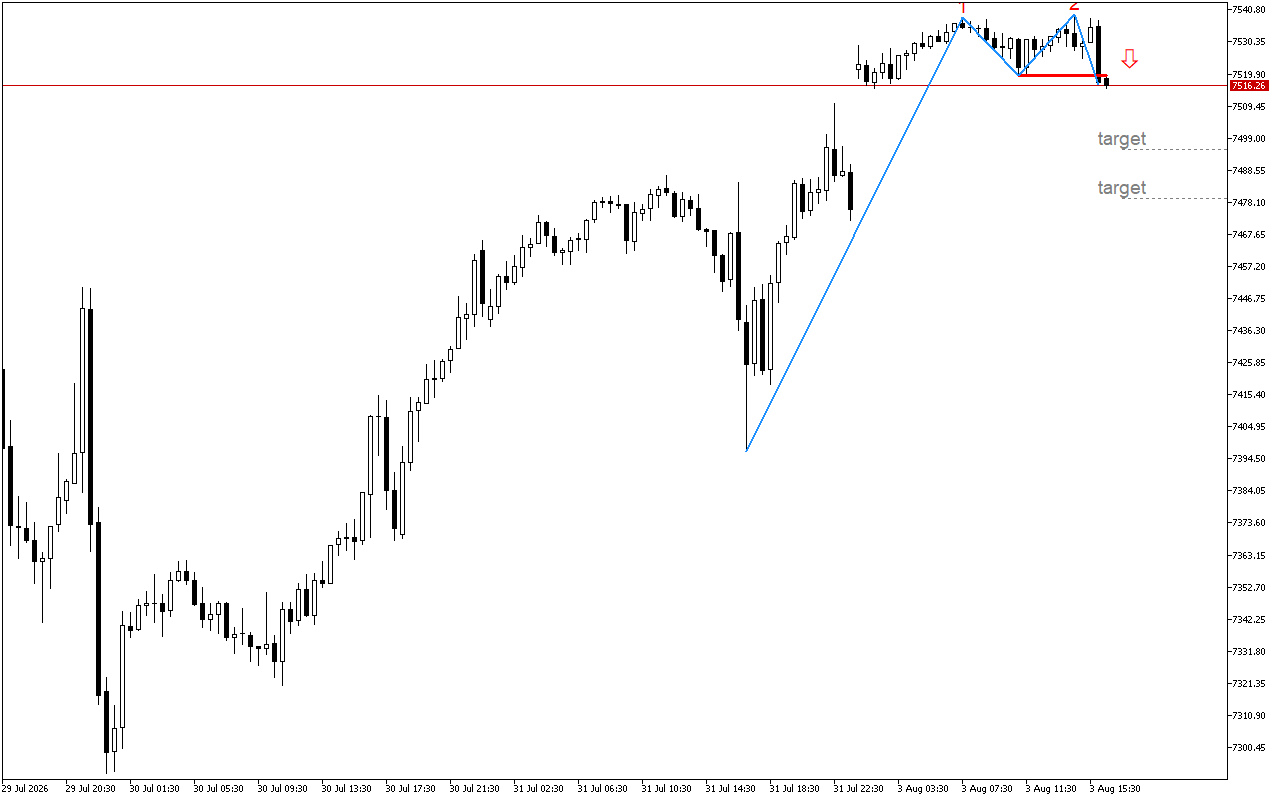
The S&P 500 chart shows signs of weakness in the upward movement as the price fails to overcome the resistance…
The S&P 500 chart shows signs of decaying upward momentum.A classic Double Top reversal pattern is being formed on the…
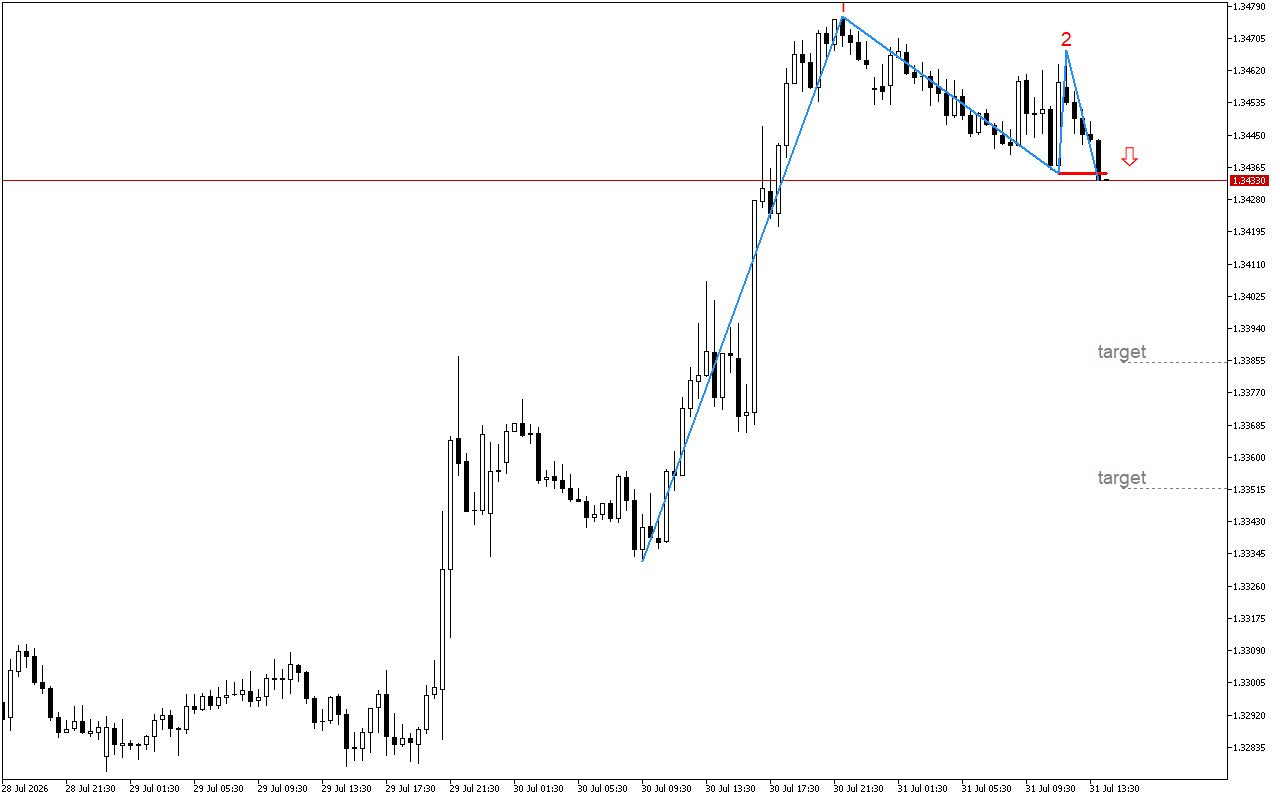
The GBPUSD chart shows signs of weakening of the current upward movement.A classic Double Top reversal pattern is being formed…
The pressure is easing. A support line has formed on the S&P 500 chart.A Double Bottom pattern is being formed…
The pressure is easing. A support line has formed on the GBPUSD chart.A Double Bottom pattern has formed on the…
In the current timeframe, there is a decrease in the selling interest. This may lead to the reversal of GBPUSD.A…
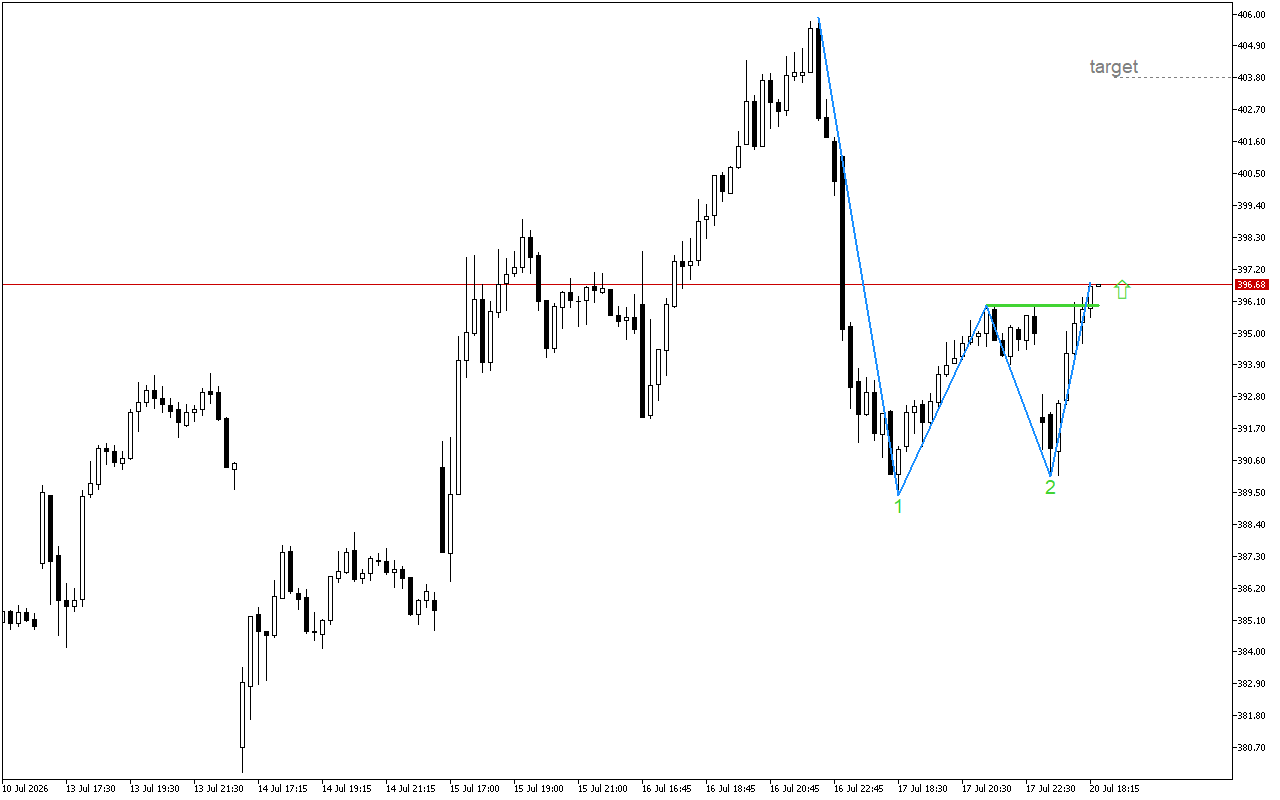
In the current timeframe, there is a decrease in the selling interest. This may lead to the reversal of Microsoft.A…
The pressure on GBPUSD is easing. This could lead to a reversal in the price movement.A Double Bottom pattern is…